Producing Charts with AI
Tomasz Tunguz
JULY 16, 2023
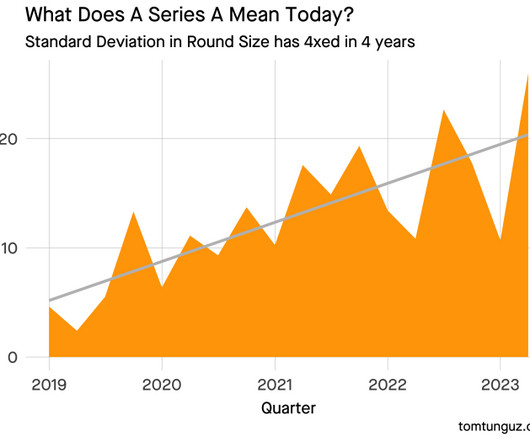
Last Monday, I published a chart that looked like this. It shows the standard deviation in Series A round sizes over time. I needed about 20 minutes using a language called R to create it. Then I tried to replicate it using ChatGPT3’s Code Interpreter feature & I spent less than 5 minutes duplicating it, most of the time waiting for the computer (see video at the end of the post).


Let's personalize your content