
Baris Guzel
and venture capital. He is a partner at BMW i Ventures, where
he has led investments and supported many companies as a board
director/observer.
Until recently, many startups have prioritized growth at all costs, using abundant venture capital to acquire users and dominate markets without regard for profitability or sustainability. However, recent market conditions have shifted toward “efficient growth,” balancing growth with profitability to create a sustainable path to scale.
As investors, we are laser-focused on identifying efficient growth early in the company’s journey. What are the early indicators of a startup’s long-term success and efficient growth? As we try to find the answer to this question, we use various analyses, some of which we cover in this article.
The flaws of using LTV/CAC — why we use cohorts to assess sales efficiency
Before hopping into our analyses, we want to cover why a commonly used metric could be misleading. Often, investors evaluate the go-to-market engine of a business with the LTV/CAC (lifetime value/customer acquisition cost) metric, but this metric is frequently immaterial for early-stage companies for a few reasons:
- There are too many ways to calculate LTV.
- The churn rate is not stable enough to accurately forecast customer lifetime. As an early-stage company, the rate at which a customer churns fluctuates as the company seeks to fulfill product-market fit. With a product improving over time by adding features that address customers’ needs, we would expect the churn rate to decline. Despite an improvement in a product, there are external factors beyond a company’s control, such as macro headwinds, that may encourage a higher churn rate.
- There is a time mismatch within the ratio: The LTV/CAC links today’s sales and marketing spend to the projected, discounted future cash flows of a customer, which is inherently an estimate. For example, using metrics collected during COVID-19 to predict the future would likely result in inaccurate forecasts.
Given the various ways LTV can be calculated, the lack of steady-state churn rate data, and the estimated value of the LTV/CAC calculation, there may not be a true sense of what drives acquisition and retention of a company’s customers. Considering the shortcomings of the LTV/CAC calculation, we propose using a cohort analysis to plot how long it takes to pay back the initial sales and marketing spend to acquire each cohort.
What are cohorts, and why are they important?
A cohort analysis is a method to assess businesses by clustering customers into groups (cohorts) starting at different points of acquisition and observing how they behave over defined intervals of time. Tracked behaviors include the number of orders placed, amount of spend, and number of features used over periods.
One can apply this analysis to various business models, such as SaaS, fintech, and even marketplaces (back then, we used it to analyze a ride-hailing company). An analysis of cohorts is valuable because observing a particular variable over time allows one to understand the business narrative of revenue, acquisition costs, and churn over a single cohort and across cohorts.
Here’s how we conduct the analysis:
- After conducting the cohort analysis for revenue over time, we can apply a gross margin to calculate the gross margin by cohort over time.
- We then calculate the fully loaded sales and marketing spend one period before the acquisition period of a particular cohort. The fully loaded spend should include factors such as sales and marketing salaries, commissions, marketing spend, and sales software.
- Finally, we calculate and plot how long it takes to pay back the initial sales and marketing costs per cohort.
As investors, we leverage cohort analyses to elucidate the mechanisms of growth, retention, and sales efficiency.
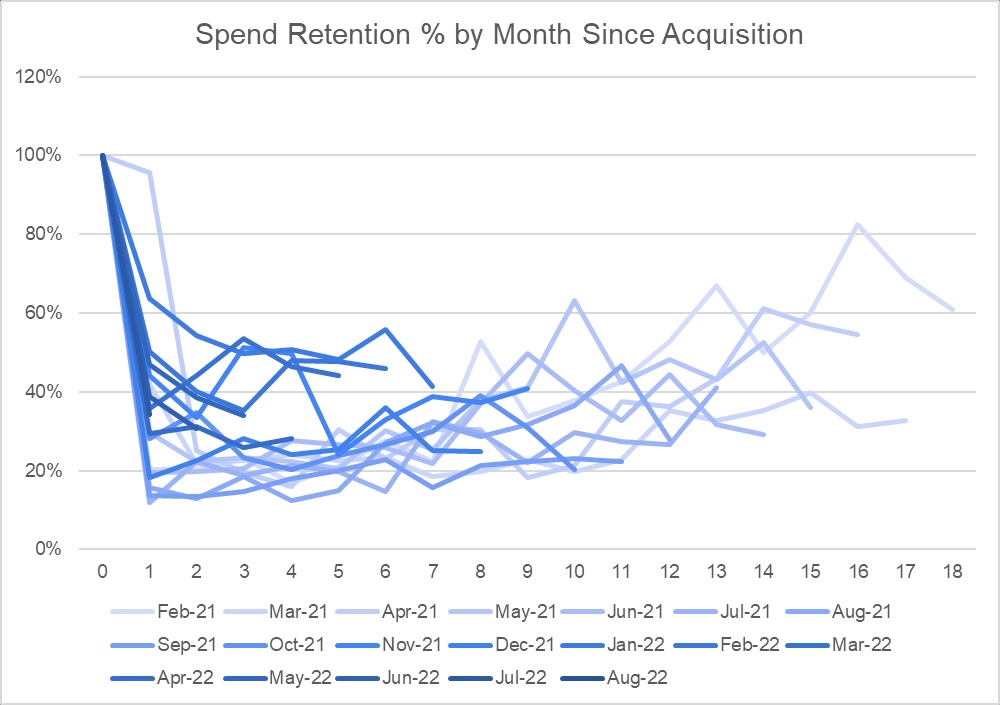
In Figure 1, you may notice that:
- Customers from cohorts initially decrease their proportion of spend after the first month and, in later months, return to spend more. The retention curve suggests that a company’s product development or network effects encourage existing users to keep spending or churned users to return.
- Newer cohorts (denoted by darker shades of blue) retain a more significant proportion of spend since the initial month of spend.
By analyzing cohorts, you may also deduce that customers’ spending is seasonal, revenue growth stems from increasing sales volume rather than price increases, or sales efficiency improves over time due to the stickiness of a product.
Rolling payback analysis helps us identify efficient growth
By conducting a rolling sales and marketing payback analysis, we can determine how long it takes for the company to pay back the initial acquisition costs within a single cohort and across multiple cohorts. Figures 2 and 3 show examples of an improving acquisition payback and a deteriorating acquisition payback.

In Figure 2, we see that the company is acquiring newer cohorts (denoted with darker shades of blue) who pay back the acquisition costs more quickly than the older cohorts. This can result from factors such as increasing margins while maintaining flat acquisition spend or increasing customer revenue (both new and retained) over time.
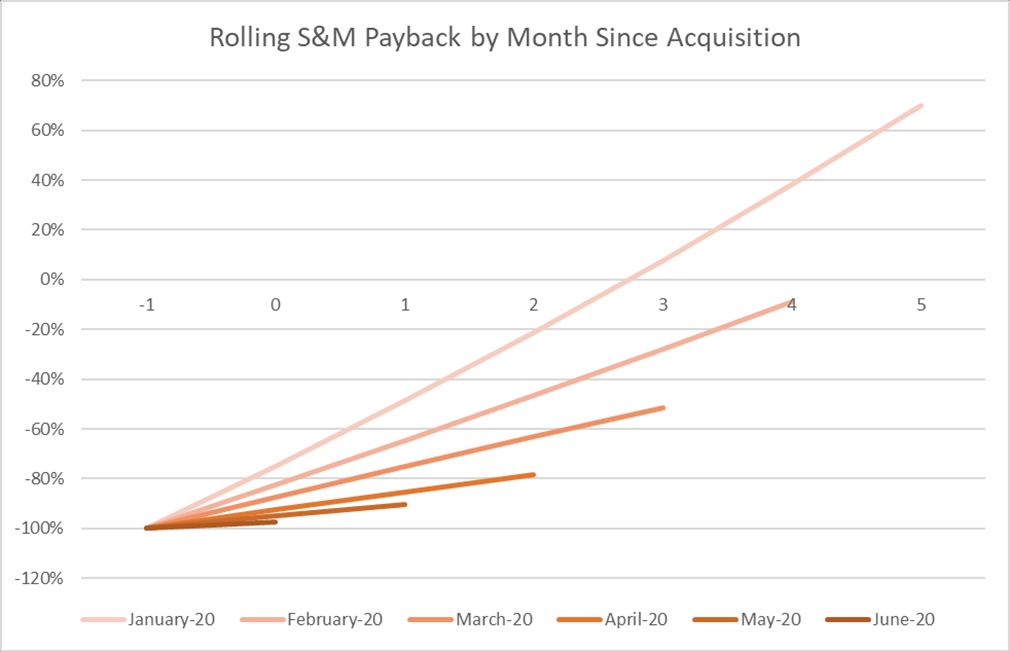
Figure 3 shows an example of deteriorating acquisition payback. The company is acquiring newer cohorts who pay back the acquisition costs more slowly than older cohorts. This can be a result of factors such as increasing sales and marketing costs while customer revenue or gross profit is held constant or decreases over time.
As hinted in Figures 2 and 3, we, as investors, want to understand the levers of growth through longitudinal data shown from cohorts. Assessing the rolling acquisition payback period gives us a window into the engine of growth. The payback period is a function of (1) gross margins, (2) customer revenue and retention, and (3) initial sales and marketing acquisition costs. Toggling these variables will give us an understanding of how a company generates value.
This analysis is particularly helpful if we can compare two companies. Assume we have two quickly growing companies in terms of revenue that are operating in the same space. Suppose we notice that one’s payback period is declining for later cohorts. In that case, we can conclude that growth is becoming more efficient over time due to increasing margins, increasing customer revenue, decreasing acquisition costs, or all of the above. If the other company’s payback period grows for later cohorts, we can deduce that increasing sales and marketing spend is the growth lever.
As such, we recommend that founders of all stages with applicable business models calculate the sales and marketing payback period of cohorts, as the analysis will convey detailed insights to see what levers are driving growth.
Case study: Rolling payback analysis in action
Walking through a case study that compares two companies using a rolling sales and marketing payback analysis will illustrate its ability to convey how businesses drive growth. Say we have two competing companies (Company A and Company B) in the United States that offer marketplaces for selling industrial parts. Company A is a relatively new player compared to Company B, which started one year before Company A. Company B has developed a feature to bundle multiple orders and ship them together. In contrast, Company A still has that feature forthcoming within the product roadmap.

From viewing the numbers in Figure 4, we can see that Company B has a higher net revenue and take rate percentage (how much money a company makes on a transaction in the marketplace) compared to Company A. In 2022, Company A achieved $3.6 million in net revenue with a 12% take rate, implying $30 million in gross revenue. In the same year, Company B scaled orders across the country with approximately $21 million in net revenue with a 16% take rate, implying $134 million in gross revenue. In addition, Company A and Company B grew by approximately 200% in net revenue for 2022. Despite being more mature than Company A, Company B is growing just as fast as the younger competitor from a net revenue perspective. Thus, from a topline perspective, Company B looks more attractive than Company A.
Now we will plot the rolling sales and marketing acquisition payback:
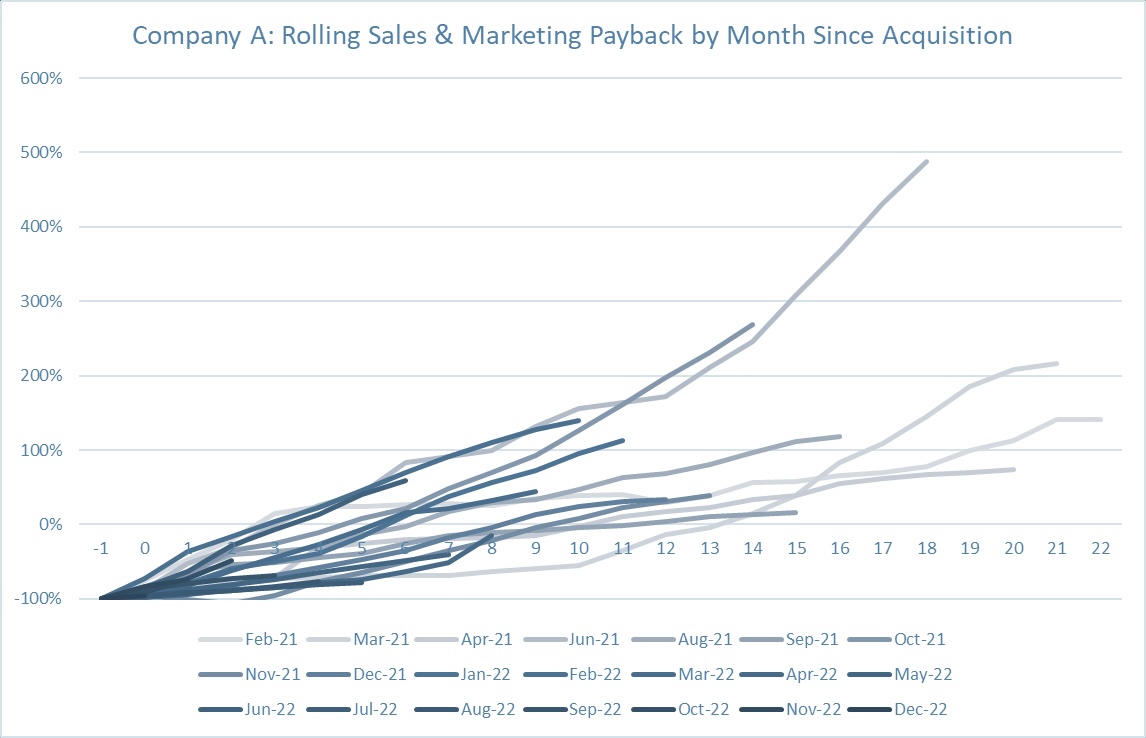

For Company A, more than half of the monthly cohorts can pay back the acquisition costs at an average of seven months. For Company B, we see that approximately 14% of the cohorts could repay the acquisition costs. By comparing the rolling payback charts, we can see that Company B is burning cash to acquire growth. At first glance, companies showing high growth may appear interesting, yet this analysis shows that companies demonstrating efficient growth offer much more compelling investment cases.
Getting beyond LTV/CAC calculations
Now that recent market conditions have shifted toward “efficient growth,” it’s time for startups to dig deeper into fundamental metrics and go beyond LTV/CAC calculations. To balance growth with profitability, we recommend conducting a rolling payback analysis using the process above.


Comment